Wireshark provides a lot of different statistics which can be consulted
if you click on the "statistics" field on the top of the screen.
We will present below, some statistics examples:
 Summary
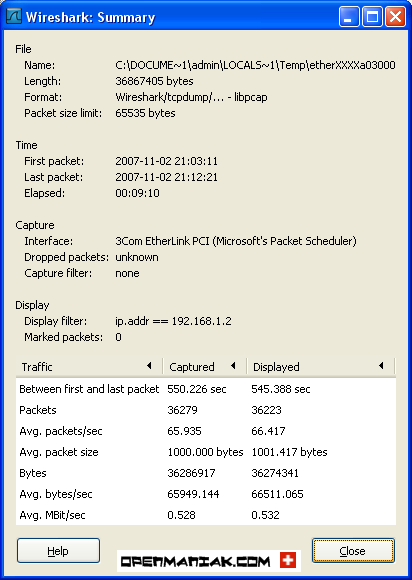
Basic global statistics are available in the summary window such as:
- Capture file properties
- Capture time
- Capture filter information.
- Display filter information.
 Top of the page
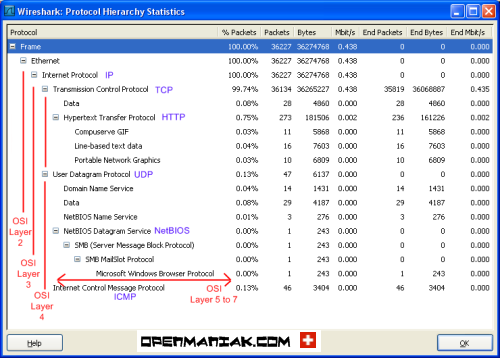
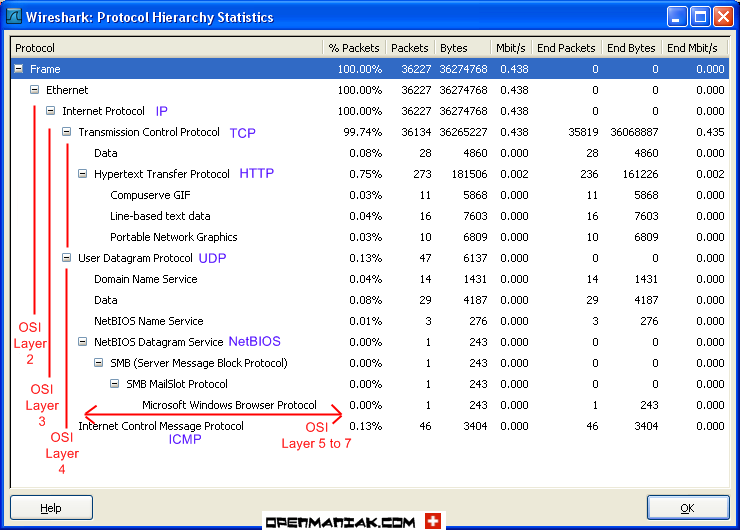
Protocol Hierarchy
The protocol hierarchy shows a dissection per OSI layer of the displayed data.
Top of the page
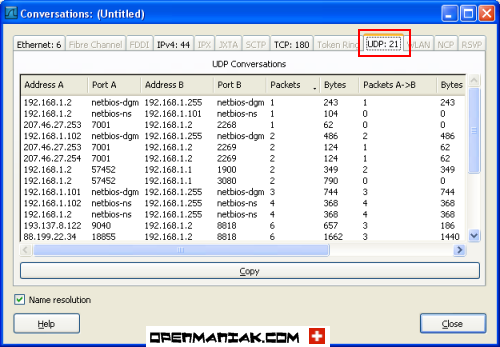
Conversations
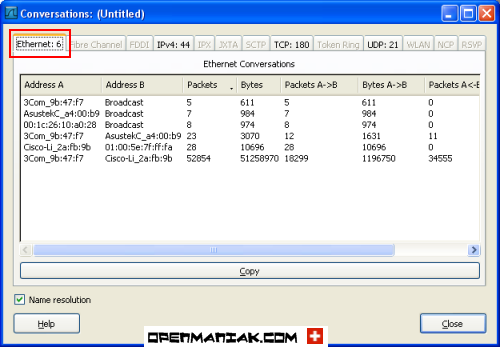
If you use TCP/IP suite application or protocol, you should find four active tabs for Ethernet, IP, TCP and UDP conversations. A "conversation" represents the traffic between two hosts.
The number in the tab after the protocol indicates the number of conversations. For instance: "Ethernet:6".
 Ethernet conversations:
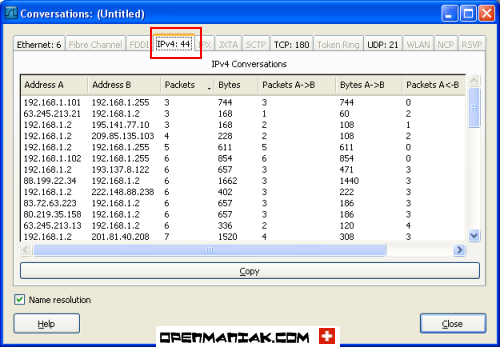
IP conversations:
TCP conversations:
UDP conversations:
Top of the page
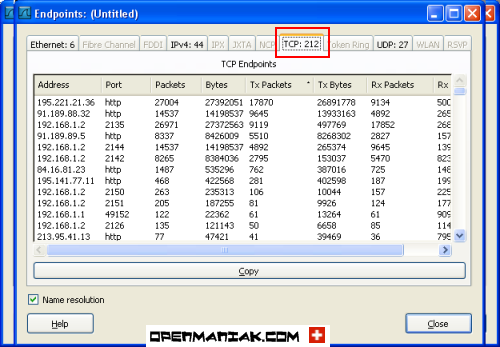
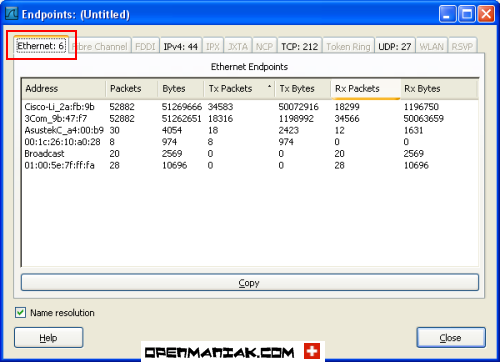
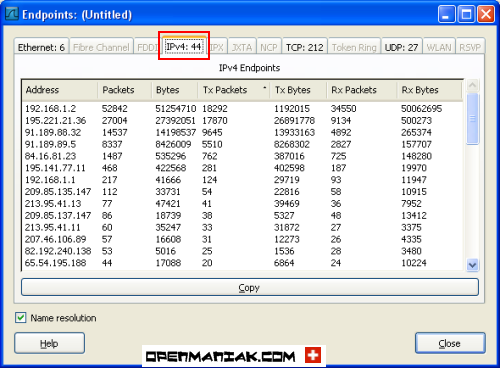
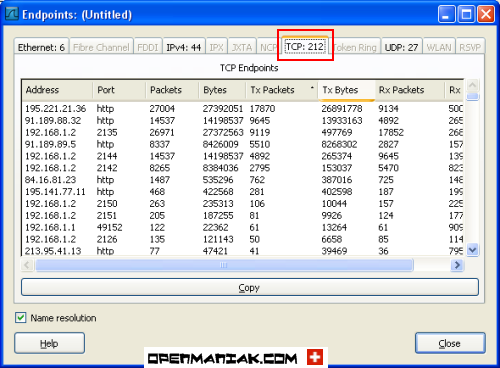
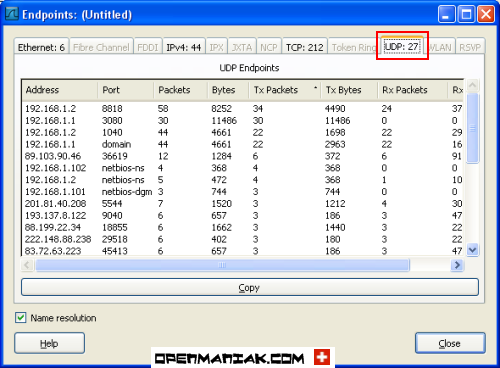
Endpoints
The endpoints provide statistics about received and transmitted data on a per machine base.
The number after the protocol indicates the number of endpoints. For instance: "Ethernet:6".
Ethernet endpoints:
IP endpoints:
TCP endpoints:
UDP endpoints:
Top of the page
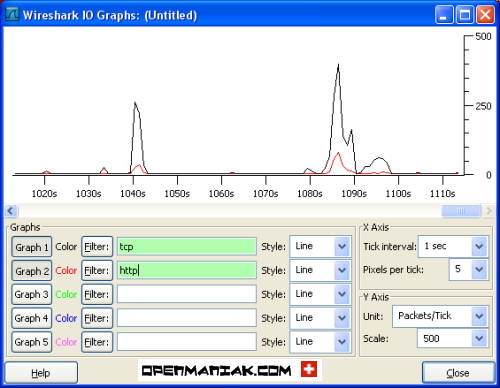
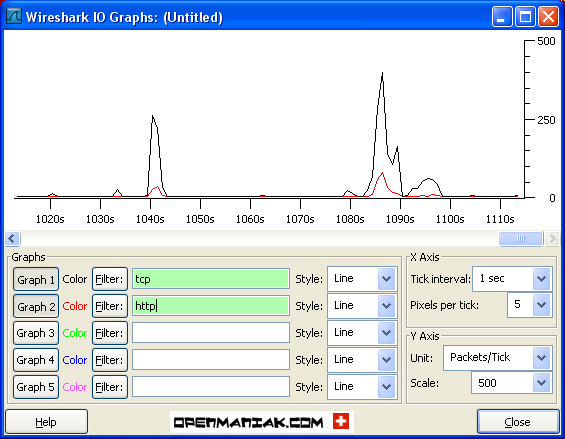
IO Graphs
Basic graphics can be obtained under the "IO graphs" section.
Multiple graphics can be added in the same window on a per display filter base.
In our example below, we chose to draw two graphs depending on a "tcp" and "http" display filter.
Top of the page
Conversation List
The "Conversation List" section provides the same information as the one given by the "Conversations" section.
Top of the page
Endpoint List
The "Endpoint list" section provides the same information as the one given by the "Endpoints" section.
Top of the page
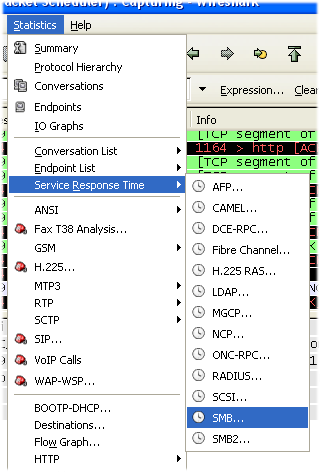
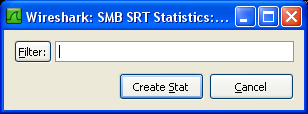
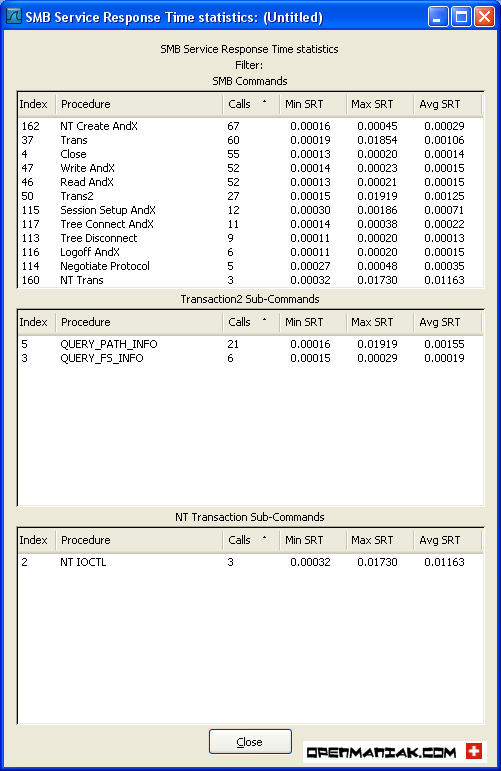
Service Response Time
13 protocols are available for an in-depth inspection.
In our example we chose SMB (Server Message Block) which runs on top of the NetBIOS protocol (see Protocol Hierarchy screenshot) and is typically used when files are shared on a Local Microsoft Windows environment.
The Wireshark display filter is shown in the smb filter field.
In our example, we have no display filter.
Top of the page
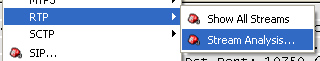
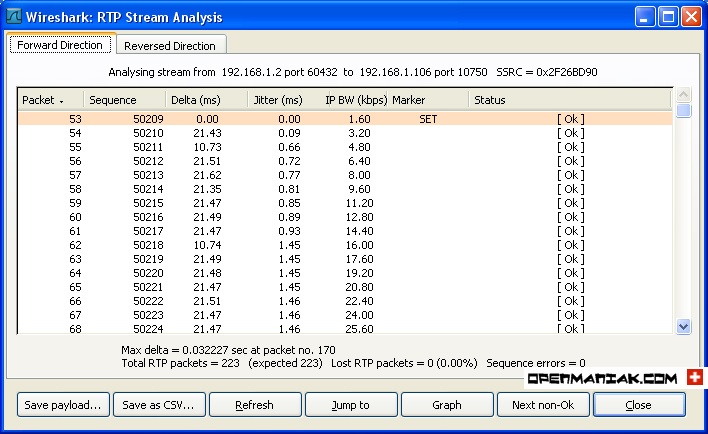
RTP
RTP (Real-time Transport Protocol, RFC 3550) is a protocol for carrying voice and video communications over an IP network. It runs on the top of the User Datagram Protocol. (UDP)
It is frequently used in conjunction with SIP or H.323 which provide the signaling tasks.
Show all streams
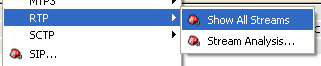
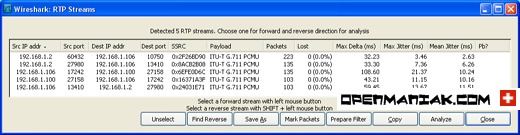
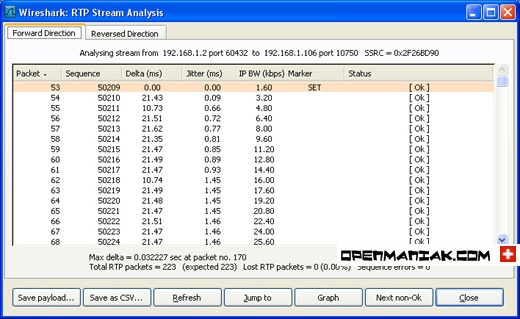
Stream analysis
Top of the page
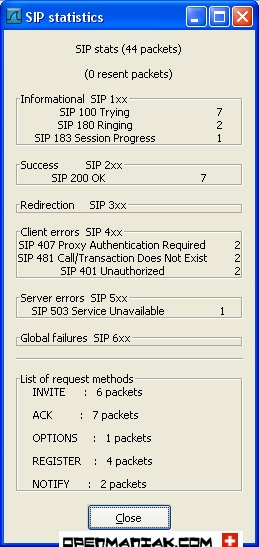
SIP
SIP (Session Initiation Protocol, RFC 3261) is a signaling protocol for establishing VoIP or video sessions.
It works typically with the RTP protocol which is used to transmit multimedia data.
Top of the page
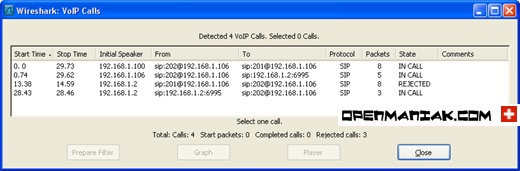
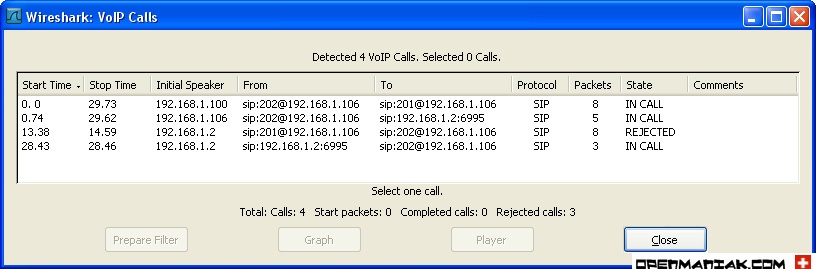
VoIP Calls
VoIP (Voice over IP) generally uses two types of protocols:
- signaling protocols such as SIP or H.323
- carrying protocols such as RTP
Top of the page
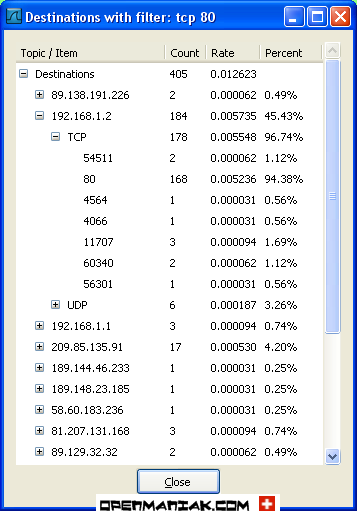
Destinations
The "Destinations" section shows all the destination IP addresses of the network packets.
Top of the page
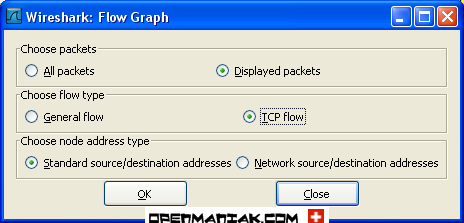
Flow Graph
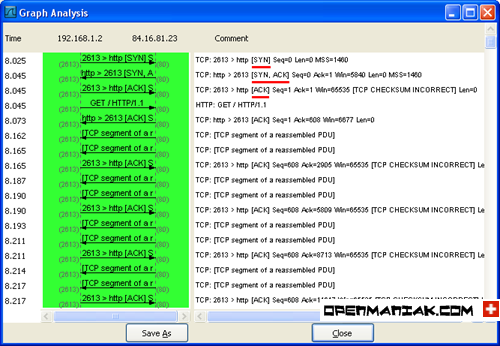
The "Flow Graph" section provides a sequential analysis of TCP connections.
In our example, we created a displayed filter to target only traffic to the openmaniak.com website.
The three first lines show a TCP connection establishment with the "SYN", "SYN ACK" and "ACK" sequences.
Top of the page
HTTP
HTTP (Hypertext Transfer Protocol) is a client-server communication protocol used to transfer HTML files.
An HTTP client, most of the time a web browser, sends an HTTP request to a web server with the well-known "URL" field to locate the file. The web server will answer with an HTTP response and provides to the client the desired web page.
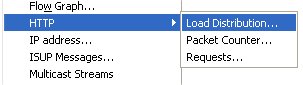
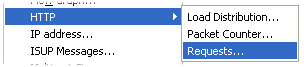
Three sub-sections are available under "HTTP":
- Load Distribution
- Packet Counter
- Requests
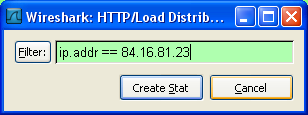
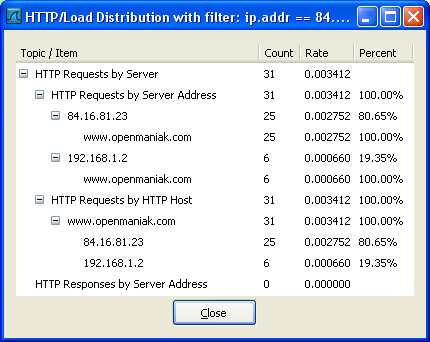
Load distribution:
In our example, we created a displayed filter to target only trafic to the openmaniak.com website.
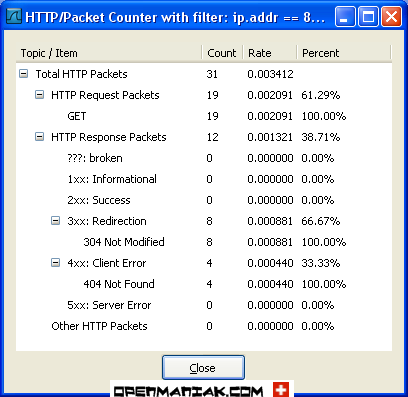
Packet Counter:
Display the HTTP requests and responses.
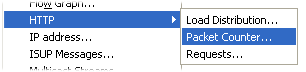
In our example, we created a displayed filter to target only traffic to the openmaniak.com website.
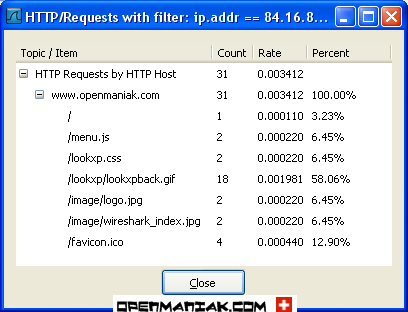
Requests:
Display the files consulted on the web server.
In our example, we created a displayed filter to target only traffic to the openmaniak.com website.
Top of the page
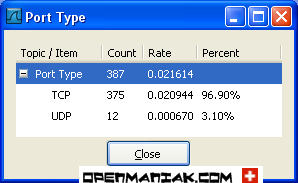
Port Type
Display TCP or UDP ports statistics.
We will present below, some statistics examples:
Summary Protocol Hierarchy Conversations Endpoints IO Graphs Conversation List Endpoint List Service Response Time |  |
RTP SIP VoIP Calls Destinations Flow Graph HTTP IP address Packet Length Port Type |
SummaryBasic global statistics are available in the summary window such as:
- Capture file properties
- Capture time
- Capture filter information.
- Display filter information.
Top of the page Protocol HierarchyThe protocol hierarchy shows a dissection per OSI layer of the displayed data.
 Top of the page Conversations
If you use TCP/IP suite application or protocol, you should find four active tabs for Ethernet, IP, TCP and UDP conversations. A "conversation" represents the traffic between two hosts.
The number in the tab after the protocol indicates the number of conversations. For instance: "Ethernet:6".
Ethernet conversations: IP conversations:
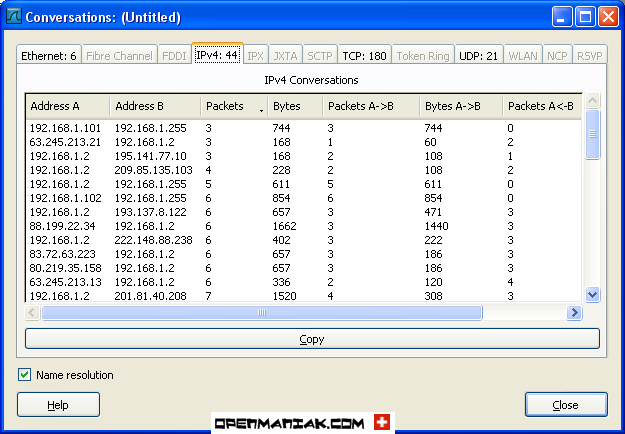 TCP conversations:
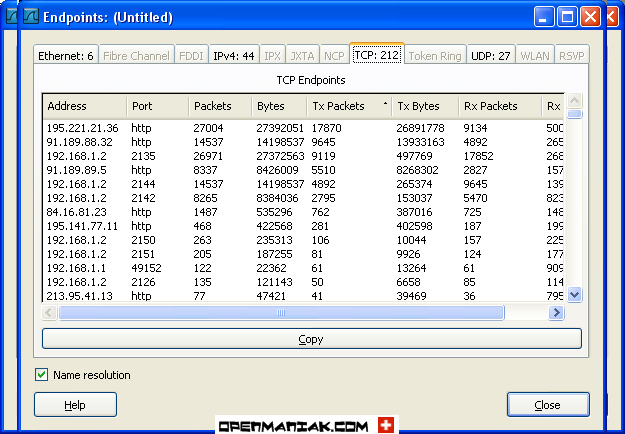 UDP conversations:
 Top of the page Endpoints
The endpoints provide statistics about received and transmitted data on a per machine base.
The number after the protocol indicates the number of endpoints. For instance: "Ethernet:6".
Ethernet endpoints: IP endpoints:
 TCP endpoints:
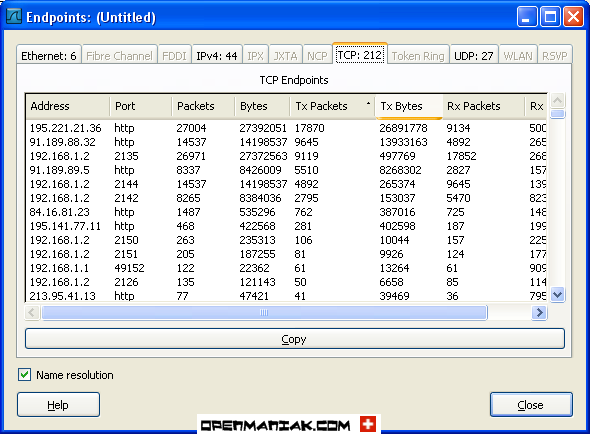 UDP endpoints:
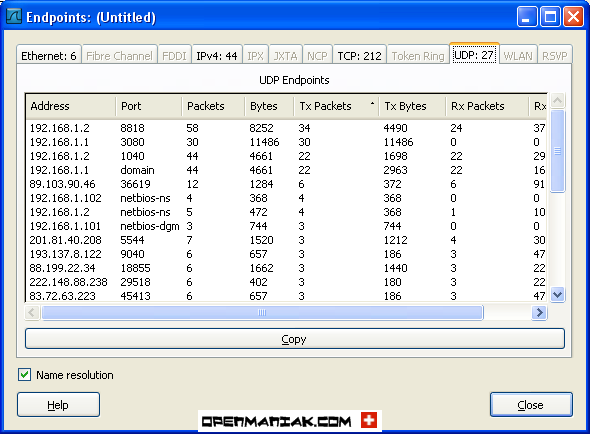 Top of the page IO Graphs
Basic graphics can be obtained under the "IO graphs" section.
Multiple graphics can be added in the same window on a per display filter base.
In our example below, we chose to draw two graphs depending on a "tcp" and "http" display filter.
 Top of the page Conversation List
The "Conversation List" section provides the same information as the one given by the "Conversations" section.
Top of the page Endpoint ListThe "Endpoint list" section provides the same information as the one given by the "Endpoints" section.
Top of the page Service Response Time13 protocols are available for an in-depth inspection.
In our example we chose SMB (Server Message Block) which runs on top of the NetBIOS protocol (see Protocol Hierarchy screenshot) and is typically used when files are shared on a Local Microsoft Windows environment.
The Wireshark display filter is shown in the smb filter field.
In our example, we have no display filter.
Top of the page RTPRTP (Real-time Transport Protocol, RFC 3550) is a protocol for carrying voice and video communications over an IP network. It runs on the top of the User Datagram Protocol. (UDP)
It is frequently used in conjunction with SIP or H.323 which provide the signaling tasks.
Show all streams
 Stream analysis
 Top of the page SIP
SIP (Session Initiation Protocol, RFC 3261) is a signaling protocol for establishing VoIP or video sessions.
It works typically with the RTP protocol which is used to transmit multimedia data.
Top of the page VoIP CallsVoIP (Voice over IP) generally uses two types of protocols:
- signaling protocols such as SIP or H.323
- carrying protocols such as RTP
 Top of the page Destinations
The "Destinations" section shows all the destination IP addresses of the network packets.
Top of the page Flow GraphThe "Flow Graph" section provides a sequential analysis of TCP connections.
In our example, we created a displayed filter to target only traffic to the openmaniak.com website.
The three first lines show a TCP connection establishment with the "SYN", "SYN ACK" and "ACK" sequences.
 Top of the page HTTP
HTTP (Hypertext Transfer Protocol) is a client-server communication protocol used to transfer HTML files.
An HTTP client, most of the time a web browser, sends an HTTP request to a web server with the well-known "URL" field to locate the file. The web server will answer with an HTTP response and provides to the client the desired web page.
Three sub-sections are available under "HTTP":
- Load Distribution
- Packet Counter
- Requests
Load distribution:In our example, we created a displayed filter to target only trafic to the openmaniak.com website.
Packet Counter:Display the HTTP requests and responses.
In our example, we created a displayed filter to target only traffic to the openmaniak.com website.
Requests:Display the files consulted on the web server.
In our example, we created a displayed filter to target only traffic to the openmaniak.com website.
Top of the page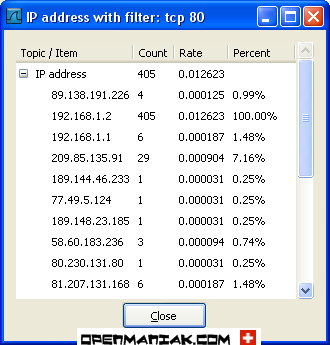
 Port Type
Display TCP or UDP ports statistics.
No comments:
Post a Comment
Thank you